From Érd to Nemesborzova, with just 31 luminaires
From 24 luminaires to nearly nine thousand: we handed over a project every year between 2013 and 2024.
Reference map
91 Hungarian municipalities on the map
Hover your mouse over a dot, or tap it: the municipality's name, the number of modernised luminaires, the annual savings and the handover year will appear. Clicking a municipality in the list also highlights it on the map.
Full list
Municipality, luminaires, savings, handover
The same data that GREP publishes on its public reference map. Click a header to sort, type in the field to filter.
| Municipality | Luminaires | kWh/year | tCO₂/year | Handover |
|---|---|---|---|---|
| Érd | 8,767 | 933,953 | 352.7 | 2016 |
| Gyöngyös | 3,191 | – | – | 2020 |
| Jászapáti | 1,862 | 200,991 | 62.0 | 2023 |
| Bátonyterenye | 1,658 | 401,458 | 151.7 | 2016 |
| Lajosmizse | 1,583 | – | – | 2023 |
| Pilisvörösvár | 1,567 | 320,059 | 120.9 | 2023 |
| Solymár | 1,390 | 288,687 | 109.0 | 2021 |
| Fehérgyarmat | 1,328 | 295,378 | 104.9 | 2021 |
| Komló | 1,048 | – | – | 2011 |
| Füzesabony | 929 | 181,740 | 68.6 | 2023 |
| Nyírtelek | 846 | 153,161 | 60.6 | 2021 |
| Újkígyós | 778 | 74,739 | 39.6 | 2022 |
| Nyírmada | 632 | 87,954 | 38.3 | 2022 |
| Nagyhalász | 631 | 132,010 | 49.6 | 2022 |
| Nyírbogát | 618 | 97,629 | 37.1 | 2022 |
| Békésszentandrás | 602 | 104,705 | 39.5 | 2023 |
| Kocsord | 533 | 86,853 | 35.7 | 2022 |
| Hort | 527 | 89,542 | 33.8 | 2019 |
| Tunyogmatolcs | 479 | – | – | 2024 |
| Szilvásvárad | 434 | – | – | 2024 |
| Újhartyán | 433 | 59,498 | 22.5 | 2017 |
| Vaja | 413 | 65,163 | 27.8 | 2022 |
| Pétervására | 382 | 72,445 | 27.4 | 2019 |
| Ábrahámhegy | 343 | 60,060 | 22.7 | 2020 |
| Gyöngyöstarján | 340 | 81,275 | 30.7 | 2017 |
| Ajak | 335 | 59,498 | 22.5 | 2020 |
| Jánkmajtis | 334 | 68,862 | 33.0 | 2023 |
| Tuzsér | 325 | 45,425 | 17.1 | 2019 |
| Pátroha | 320 | 42,860 | 16.2 | 2020 |
| Tiszakarád | 318 | 54,163 | 20.5 | 2019 |
| Pusztadobos | 312 | 59,714 | 22.6 | 2020 |
| Szabadkígyós | 307 | – | – | 2024 |
| Mátraverebély | 306 | 22,020 | 8.3 | 2017 |
| Buj | 302 | 38,718 | 14.6 | 2019 |
| Nagyvarsány | 299 | 53,381 | 19.7 | 2023 |
| Kakucs | 290 | 43,853 | 16.6 | 2019 |
| Perbál | 290 | 42,546 | 15.4 | 2018 |
| Sajókaza | 287 | 48,118 | 20.3 | 2022 |
| Karcsa | 284 | 20,321 | 10.6 | 2022 |
| Tiszatelek | 256 | 39,005 | 15.4 | 2020 |
| Nyírgelse | 251 | 38,618 | 15.3 | 2021 |
| Nyírvasvári | 249 | 33,798 | 13.0 | 2023 |
| Piricse | 240 | 45,972 | 18.8 | 2022 |
| Gyulaháza | 220 | 31,884 | 12.0 | 2020 |
| Pilisjászfalu | 215 | – | – | 2024 |
| Encsencs | 210 | 40,178 | 15.2 | 2020 |
| Göncruszka | 210 | 8,558 | 3.2 | 2019 |
| Tatárszentgyörgy | 210 | 33,902 | 13.1 | 2022 |
| Ura | 209 | 25,352 | 9.4 | 2021 |
| Gulács | 203 | 29,681 | 11.2 | 2018 |
| Gyüre | 203 | – | – | 2023 |
| Nyírcsászári | 199 | – | – | 2024 |
| Tiszacsermely | 192 | 29,354 | 11.1 | 2019 |
| Remeteszőlős | 191 | 25,240 | 10.0 | 2022 |
| Beregdaróc | 189 | 27,086 | 10.2 | 2020 |
| Tiszakerecseny | 185 | 31,229 | 11.8 | 2020 |
| Kővágóörs | 184 | 24,329 | 9.2 | 2017 |
| Gemzse | 183 | 30,992 | 11.7 | 2020 |
| Komoró | 172 | 28,205 | 10.7 | 2020 |
| Aldebrő | 161 | 20,612 | 7.8 | 2019 |
| Lácacséke | 157 | 20,097 | 8.0 | 2021 |
| Semjén | 155 | 18,577 | 7.0 | 2019 |
| Nábrád | 154 | 31,556 | 12.5 | 2020 |
| Tiszaszalka | 153 | 27,060 | 10.2 | 2022 |
| Zalaszántó | 149 | 14,345 | 5.3 | 2018 |
| Vámosatya | 147 | 31,208 | 11.8 | 2020 |
| Nyírparasznya | 144 | 29,853 | 11.8 | 2021 |
| Nagyrozvágy | 138 | 22,188 | 8.4 | 2019 |
| Tiszaadony | 138 | 3,974 | 11.0 | 2023 |
| Erdőkövesd | 134 | 27,016 | 10.2 | 2020 |
| Tiszaszentmárton | 134 | 16,734 | 6.3 | 2019 |
| Balatonrendes | 133 | 33,820 | 12.8 | 2018 |
| Eperjeske | 115 | 17,336 | 6.5 | 2019 |
| Körösújfalu | 114 | – | – | 2024 |
| Eplény | 100 | 13,892 | 5.2 | 2018 |
| Karos | 100 | 10,063 | 3.8 | 2019 |
| Kisszekeres | 99 | 21,941 | 9.0 | 2021 |
| Hermánszeg | 98 | 16,726 | 6.6 | 2021 |
| Újdombrád | 97 | 13,454 | 5.7 | 2021 |
| Tákos | 91 | 18,494 | 7.0 | 2020 |
| Győrvár | 90 | – | – | 2024 |
| Váckisújfalu | 90 | 13,618 | 5.1 | 2018 |
| Váraszó | 84 | 21,745 | 8.2 | 2020 |
| Zsarolyán | 78 | 16,710 | 6.6 | 2021 |
| Márokpapi | 72 | 5,368 | 12.5 | 2020 |
| Darnó | 63 | 9,931 | 3.9 | 2021 |
| Szentantalfa | 60 | 5,771 | 2.2 | 2018 |
| Karakó | 59 | 7,569 | 3.0 | 2022 |
| Balatonhenye | 56 | – | – | 2019 |
| Kisfüzes | 55 | 6,324 | 2.4 | 2020 |
| Nemesborzova | 31 | 4,185 | 1.7 | 2021 |
Scroll the table sideways for more columns.
Source: GREP Zrt. references, public map, and the GREP corporate group's reference list, as of March 2025. Where no value is shown, the savings accrue to the municipality.
Scheme
Distribution by scheme type
The vast majority of the 91 Hungarian projects were carried out as a classic EPC service, meaning with no municipal funding or loans.
Handovers
Year of project handover
Hungary and Slovakia combined, from 2013 to 2024: we handed over completed projects in twelve consecutive years.
Recently on site
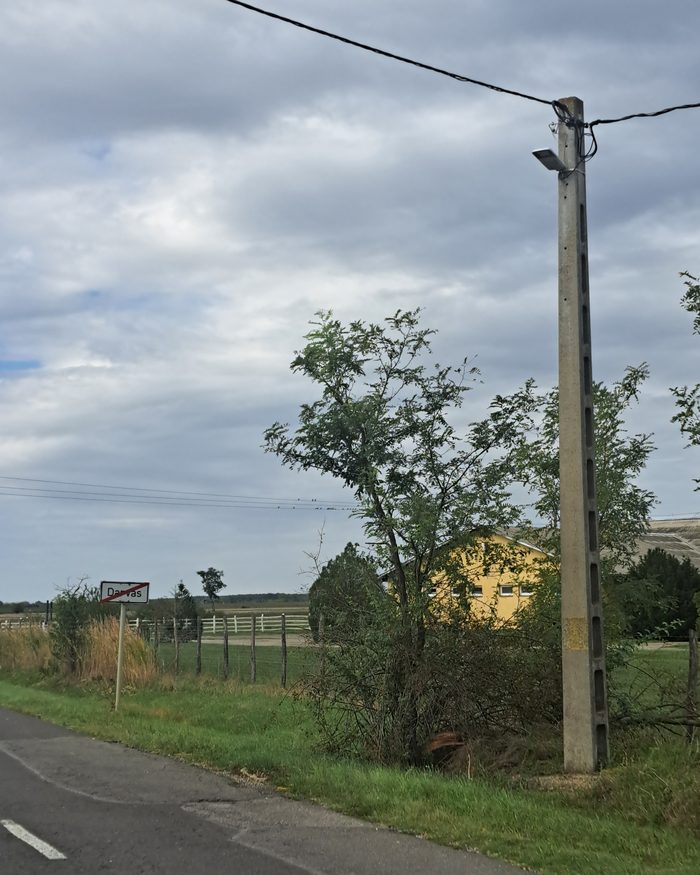
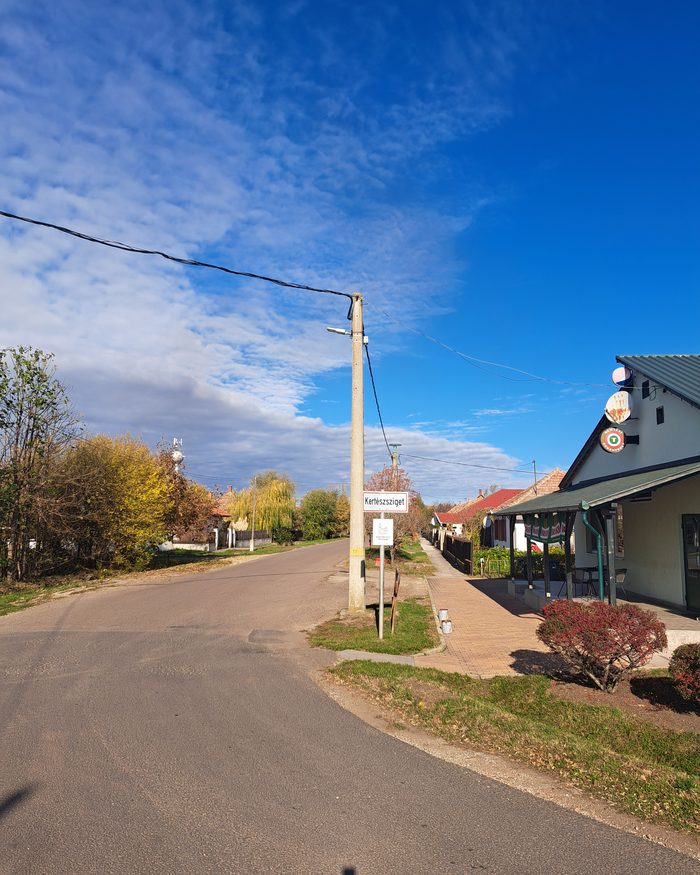
Recent photos from our installations
A few recent photos from our installations. These 2025 installations are not yet included in the statistics above, which reflect the situation as of March 2025.
Your municipality could be on this list too. Request a free feasibility study